
Introduction
Modern organizations generate enormous amounts of customer and business data through their CRM platforms. Microsoft Dynamics 365, for example, captures valuable information about customers, leads, opportunities, sales activities, customer service interactions, and business operations.
However, collecting business data is only one part of the equation. The real challenge is transforming that data into meaningful information that executives can use to make informed decisions.
Many organizations invest heavily in Microsoft Dynamics 365 and Power BI, expecting seamless reporting and advanced analytics. Yet, when they start building executive dashboards, they encounter familiar problems: inconsistent data definitions, duplicated records, complicated relationships, disconnected systems, and conflicting business metrics.
Why does this happen?
Because having access to business data does not automatically mean that the data is ready for analytics.
This is where the Microsoft Common Data Model (CDM) becomes important. It provides a standardized and extensible foundation for representing business information across applications and services.
In this article, we will explore how the Common Data Model can bridge the gap between Dynamics 365 and executive dashboards, why it matters for CRM analytics, and how organizations can use it as part of a modern Microsoft data architecture.
1. Understanding the Common Data Model (CDM)
The Common Data Model is a standardized collection of business data schemas, entities, attributes, relationships, and metadata developed by Microsoft.
Its primary purpose is to provide a common language for business data so that different applications and services can understand and exchange information more consistently.
For example, consider a customer record.
One application might identify a customer using the term Customer, another might use Account, and a third might maintain its own customer-related structure.
Although these systems may represent similar business concepts, their data structures and definitions can differ.
The Common Data Model helps address this challenge by providing standardized definitions for commonly used business concepts.
Some examples include:
- Account
- Contact
- Customer
- Product
- Opportunity
- Lead
- Sales Order
- Invoice
- Campaign
- Activity
These standard definitions can be extended to accommodate organization-specific requirements without losing the benefits of a shared structure.
Microsoft Dataverse and various Dynamics 365 applications use Common Data Model concepts and schemas to support business applications and data interoperability.
In simple terms, CDM helps different systems speak a more consistent business language.
2. Why Dynamics 365 Data Alone Is Not Enough for Executive Analytics
Dynamics 365 is an excellent platform for managing customer relationships and business operations. However, executive analytics often requires information that extends beyond the boundaries of a single CRM environment.
Imagine a company using the following systems:
- Dynamics 365 Sales for leads, accounts, and opportunities.
- Dynamics 365 Customer Service for customer support cases.
- An ERP system for invoices and financial transactions.
- A marketing platform for campaigns and customer engagement.
- Power BI for reporting and executive dashboards.
Each system maintains information based on its own operational requirements.
When executives request a unified business dashboard, the analytics team must bring these sources together.
Several challenges can arise.
Inconsistent business definitions
Different departments may calculate the same business metric differently.
For example, the sales department may consider an opportunity successful when it reaches a particular stage, while the finance department recognizes revenue only after an invoice is generated.
Without agreed definitions, executive reports can produce conflicting numbers.
Different data structures
Systems may use different field names, identifiers, relationships, and formats to represent similar business entities.
Connecting these sources directly can require extensive transformation and mapping.
Data duplication
Customer information may exist in Dynamics 365, marketing platforms, and ERP systems.
Without appropriate matching and data governance, the same customer may appear multiple times in reports.
Complex reporting logic
When business rules are implemented separately in multiple Power BI reports, maintaining consistency becomes increasingly difficult.
One dashboard might calculate the sales pipeline differently from another.
The result is a reporting environment that becomes harder to maintain and less reliable for decision-making.
The solution is not simply to build more dashboards. Organizations need a consistent data foundation before creating executive reporting.
3. The Missing Layer Between Dynamics 365 and Power BI
A traditional reporting architecture often looks like this:
Dynamics 365 → Data Extraction → Power BI → Executive Dashboard
This approach can work for relatively simple reporting requirements.
However, as organizations introduce additional systems, business rules, and analytical requirements, the architecture becomes increasingly complex.
A more scalable approach introduces a standardized data integration and modeling layer.
For example:
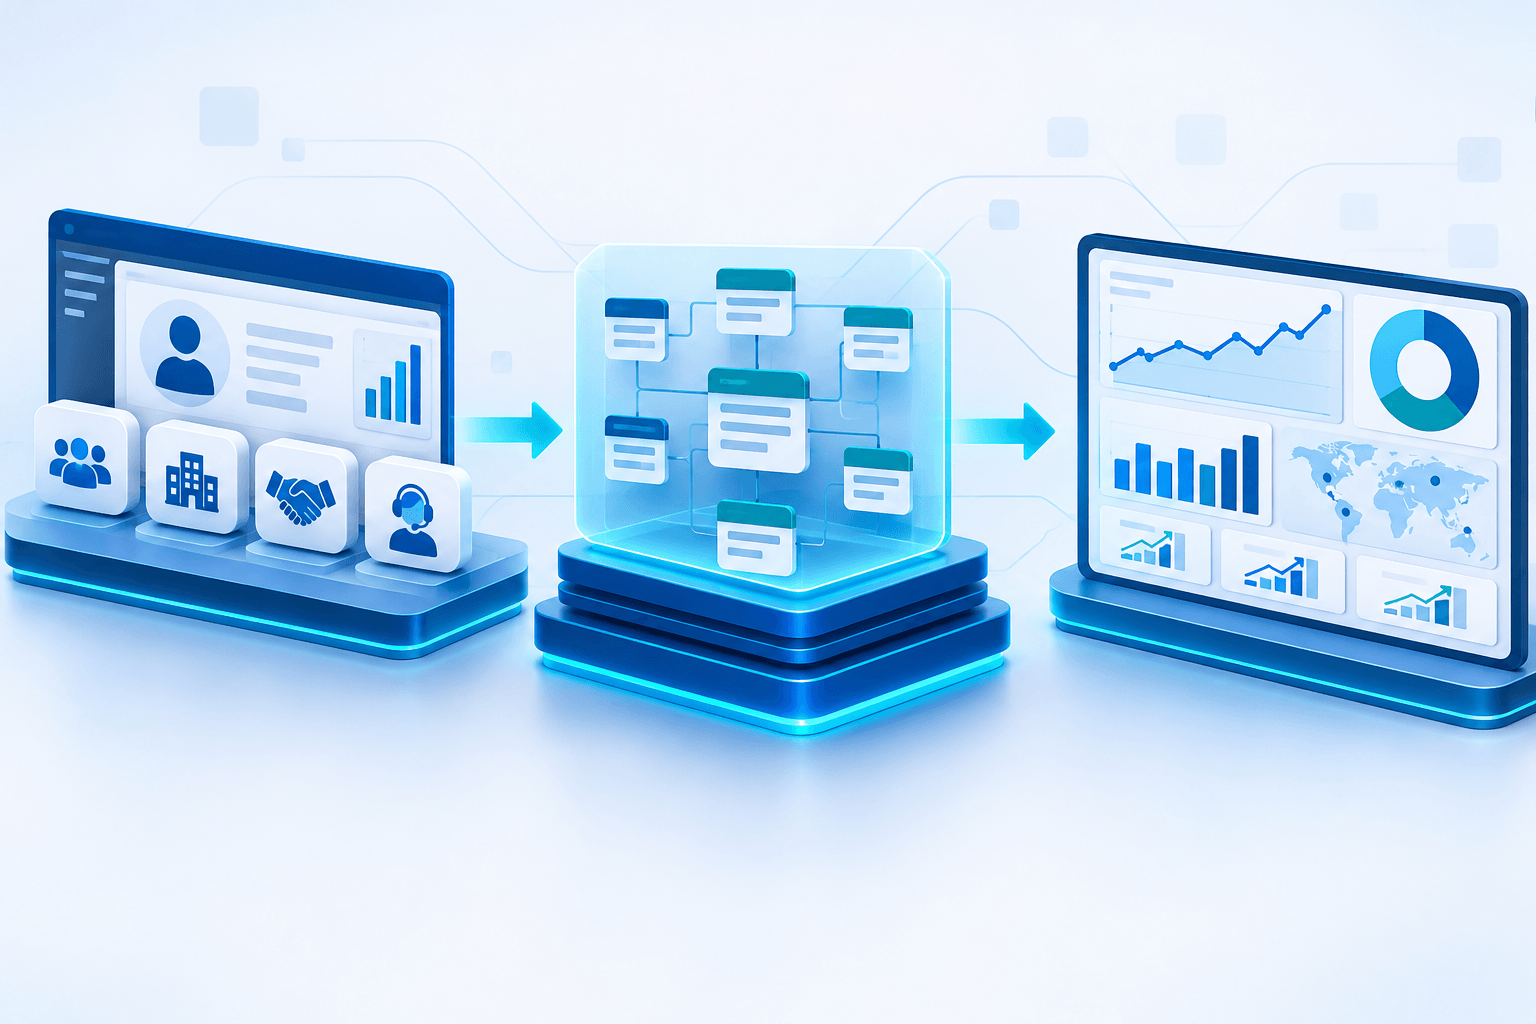
Dynamics 365 / Dataverse → Data Integration → Standardized Business Data Model → Analytical Data Model → Power BI → Executive Dashboards
The Common Data Model provides a shared language and reusable business schemas within this architecture.
It helps organizations establish consistent definitions for business entities before those entities are used across analytical solutions.
Importantly, CDM should not be viewed as a mandatory separate database between Dynamics 365 and Power BI. It is a data standard and metadata foundation that can be implemented through different architectural approaches.
For enterprise analytics, organizations often complement CDM with a curated analytical model, such as a star schema, and a governed Power BI semantic model.
These layers serve different purposes:
- Common Data Model: Standardizes business concepts and data structures.
- Analytical Data Model: Organizes data for efficient reporting and analysis.
- Power BI Semantic Model: Defines business measures, relationships, calculations, and reporting semantics.
Together, these components create a much stronger foundation for executive analytics.
4. How Common Data Model Works with Dynamics 365 and Dataverse
Microsoft Dataverse is a central data platform for many Dynamics 365 and Power Platform applications.
It provides structured business data storage, relationships, security, and extensibility.
Because Dataverse uses Common Data Model concepts, organizations can benefit from standardized business entities when building integrated applications and analytics solutions.
Consider a typical Dynamics 365 Sales environment.
It may contain:
- Accounts representing organizations.
- Contacts representing individuals.
- Leads representing potential customers.
- Opportunities representing potential revenue.
- Activities representing interactions with customers.
- Products representing items offered to customers.
These entities are connected through relationships that describe how business processes operate.
For example, an Account may have multiple Contacts and Opportunities. An Opportunity may contain multiple products and sales activities.
When these relationships are properly understood and mapped into an analytical structure, organizations can answer more meaningful questions:
- Which customers generate the highest revenue?
- Which sales representatives have the strongest conversion rates?
- How long does it take to convert a lead into an opportunity?
- Which products contribute most to the sales pipeline?
- Which customer segments generate the most business?
- How do customer service activities affect customer retention?
The Common Data Model provides a foundation for consistent business definitions, while the analytical model organizes that information for reporting.
5. A Practical CRM Analytics Architecture Using Microsoft Technologies
A modern Microsoft analytics architecture can combine Dynamics 365, Dataverse, Microsoft Fabric, and Power BI.
One possible architecture consists of the following layers.
Layer 1: Operational Data Sources
This layer contains the systems where business transactions and customer interactions occur.
Examples include:
- Dynamics 365 Sales
- Dynamics 365 Customer Service
- Microsoft Dataverse
- Dynamics 365 Finance
- External ERP systems
- Marketing platforms
- Third-party applications
These systems remain responsible for their operational processes.
Layer 2: Data Integration and Ingestion
The next step is making data available to the analytical environment.
Depending on the organization’s requirements, integration options may include:
- Dataverse Link to Microsoft Fabric.
- Azure Synapse Link for Dataverse.
- Microsoft Fabric Data Factory pipelines.
- Dataflow Gen2.
- APIs and other supported connectors.
Microsoft’s Link to Fabric capability provides a direct integration between Dataverse and Microsoft Fabric through OneLake.
This can simplify access to Dataverse data without requiring organizations to build traditional export pipelines for every integration scenario.
External data sources can be brought into the same analytical environment using appropriate ingestion mechanisms.
Layer 3: Standardization and Data Transformation
This is where consistent business definitions become particularly important.
Data from multiple sources needs to be mapped, cleaned, validated, and standardized.
For example:
- Customer identifiers should be aligned.
- Date and currency formats should be normalized.
- Duplicate records should be identified.
- Business categories should follow agreed definitions.
- Relationships between accounts, contacts, opportunities, and transactions should be validated.
Common Data Model schemas can guide the standardization of business entities.
Organizations can also introduce custom entities and attributes when their business requirements extend beyond the standard definitions.
Layer 4: Analytical Data Model
Once the data has been standardized, it can be organized into a reporting-friendly structure.
A star schema is a common approach for analytical modeling.
For example, a CRM sales analytics model might contain the following tables:
Dimension tables:
- DimCustomer
- DimProduct
- DimSalesperson
- DimDate
- DimTerritory
Fact tables:
- FactSales
- FactOpportunity
- FactLeadConversion
- FactCustomerActivity
Dimension tables provide descriptive business information, while fact tables capture measurable business events.
This separation helps improve analytical consistency and makes reporting easier to maintain.
Layer 5: Power BI Semantic Model
The semantic model provides the business-friendly layer used by Power BI reports and dashboards.
It defines relationships, measures, calculations, hierarchies, and other analytical logic.
For example, organizations can define standardized measures such as:
- Total Revenue
- Open Pipeline Value
- Lead Conversion Rate
- Average Deal Size
- Win Rate
- Customer Retention Rate
Instead of implementing these calculations independently in every report, teams can maintain common definitions in governed semantic models.
Layer 6: Executive Dashboards
Finally, the prepared data becomes available through executive dashboards.
Executives can explore business performance through:
- Sales performance dashboards.
- Customer acquisition reports.
- Revenue forecasting.
- Pipeline analysis.
- Customer service performance.
- Regional and product performance.
- Customer retention analytics.
At this stage, dashboards become more than visual representations of CRM records. They provide a consistent view of business performance.
6. Real-World Example: Building a Unified Sales Performance Dashboard
Consider an organization operating across multiple regions.
Its sales team uses Dynamics 365 Sales to manage customers, leads, and opportunities. The finance department uses an ERP system to maintain invoices and financial transactions.
Management wants a single dashboard showing:
- Total revenue by region.
- Open opportunity pipeline.
- Sales performance by representative.
- Lead conversion rates.
- Revenue generated by customer segment.
- Actual revenue compared with forecasts.
The challenge is that Dynamics 365 and the ERP system do not necessarily use identical structures or business definitions.
For example, Dynamics 365 may contain an opportunity with an estimated revenue value, while the ERP system contains the actual invoiced amount.
These are two different business measurements and should not be treated as interchangeable.
A standardized data architecture can address this by:
- Mapping CRM account records to ERP customer records.
- Establishing consistent regional and product classifications.
- Maintaining opportunity and invoice information as separate business events.
- Defining common revenue and pipeline calculations.
- Building an analytical model that connects the relevant information.
Power BI can then present the information through a unified executive dashboard.
The result is a more reliable reporting environment where management can compare actual business performance with sales expectations.
7. Benefits of Introducing a Standardized Data Model
Implementing a Common Data Model-based approach can provide several important benefits.
Improved data consistency
Standardized entities and definitions help different applications and analytical solutions interpret business information consistently.
Reduced integration complexity
Reusable schemas can reduce the need to reinvent data structures and mappings for every integration project.
Better reporting governance
Organizations can establish common business definitions and analytical standards across departments.
Improved scalability
A standardized foundation makes it easier to introduce additional data sources and analytical requirements over time.
Greater data interoperability
Common Data Model supports the exchange and reuse of business information across Microsoft technologies and other compatible solutions.
Stronger foundations for AI and advanced analytics
Well-structured, governed, and consistently defined data can support predictive analytics, machine learning, and AI-driven business insights.
However, these benefits are not automatic. They depend on good data governance, appropriate modeling, quality controls, and a well-designed implementation.
8. Common Mistakes to Avoid
Organizations should consider several important points when implementing a CDM-based analytics architecture.
1. Treating CDM as a replacement for an analytical data warehouse
CDM provides standardized business schemas. It does not eliminate the need for analytical modeling, historical data management, or performance optimization.
2. Assuming that Dataverse data is automatically ready for executive reporting
Operational data structures are designed primarily to support business applications. Reporting requirements may require additional transformations and modeling.
3. Duplicating business logic across Power BI reports
Calculations such as revenue, conversion rate, and pipeline value should have agreed definitions and ideally be maintained in reusable semantic models.
4. Ignoring data quality
Standardized schemas cannot automatically correct inaccurate, incomplete, or duplicated source records.
5. Over-customizing standard entities
Organizations should reuse standard business definitions where appropriate and introduce custom entities only when there is a genuine business requirement.
6. Ignoring security and governance
Data access, ownership, lineage, and sensitive information handling should be considered throughout the architecture.
9. Where Microsoft Fabric Fits into the Picture
Microsoft Fabric introduces additional opportunities for organizations building modern CRM analytics solutions.
With Dataverse integration, Fabric provides capabilities for accessing and analyzing business data through OneLake, lakehouses, pipelines, notebooks, SQL analytics endpoints, and Power BI.
A useful implementation pattern is the medallion architecture:
- Bronze: Preserve ingested source data.
- Silver: Clean, validate, standardize, and integrate business information.
- Gold: Publish curated analytical datasets optimized for business reporting.
The Common Data Model can guide the standardization of business entities within this architecture.
The Gold layer can then contain analytical structures such as fact and dimension tables, which feed governed Power BI semantic models.
This distinction is important: CDM provides a common business language, while the medallion architecture organizes data processing and the analytical model prepares information for consumption.
Together, they can form a scalable foundation for enterprise analytics.
10. Final Thoughts: From CRM Data to Business Intelligence
The success of a CRM analytics strategy should not be measured by the number of dashboards an organization creates.
It should be measured by how consistently and confidently business leaders can use those dashboards to make decisions.
Dynamics 365 provides valuable operational information. Dataverse offers a structured platform for business data. The Common Data Model provides standardized definitions that help applications and services understand business concepts. Microsoft Fabric provides modern data integration and analytical capabilities, while Power BI turns curated information into actionable insights.
The real opportunity lies in connecting these capabilities through a well-designed data architecture.
For organizations investing in Dynamics 365 and Power BI, the Common Data Model deserves attention as an important part of that foundation.
The missing layer between CRM data and executive dashboards is not simply another technology. It is a consistent understanding of what the data actually means.
And that is where meaningful business intelligence begins.
References and Further Reading
- Microsoft Learn – About the Common Data Model
- Microsoft Learn – Power BI Modeling Guidance for Power Platform
- Microsoft Learn – Dynamics 365 and Power Platform Data Estate
- Microsoft Learn – Integrate Dataverse with Enterprise Data in Microsoft Fabric
- Microsoft Learn – Link Dataverse to Microsoft Fabric
- Microsoft Learn – Work with Dataverse Data in Fabric and Generate Power BI Reports